...

Real-Time Sales Dashboards for Actionable Insights

Manual data entry across Excel files wastes hours before you can make a single decision. Sales dashboards solve this by centralizing your CRM data into one real-time view of total sales and conversion rates. By turning scattered data into actionable insights, you can hit sales targets without ever opening a spreadsheet.

Visualize My Data

What Are Sales Dashboards? (Explained Simply)

A sales dashboard provides a real-time visual display of your most critical metrics, much like a car’s dashboard. It automatically syncs data from your CRM, e-commerce, and POS systems, transforming complex numbers into easy-to-read charts. Because these dashboards are customized to your business goals, you get instant clarity on performance without manual reporting. In just 30 seconds, you can understand your entire sales health and make informed decisions.

Simplify My Reporting

Why Your Business Needs Sales Dashboards

Sales dashboards act as an early warning system, helping you spot and fix issues before they impact your revenue.

  • Proactive Problem Solving: Instantly identify weak pipelines or falling conversion rates before they turn into lost sales.

  • Automated Efficiency: Eliminate manual reporting and human error with real-time updates, allowing your team to focus on selling rather than spreadsheets.

  • Revenue Protection: Gain total visibility to act faster, work smarter, and keep your business on track.

Protect My Revenue

What Our Sales Dashboard Solution Offers

We build custom sales dashboards specifically for your industry, from e-commerce to tech. Here is how we differentiate:

  • Tailored to Your Workflow: We skip templates to build around your sales process and KPIs. You get focused data with custom alerts based on your specific targets.

  • Mobile-First Accessibility: Check performance on any device. Teams and executives get real-time updates and notifications whether they are at a desk or on the go.

  • Automated Reporting: Eliminate manual tasks with scheduled updates delivered via email or live links. Export your data to PDF or Excel instantly.

Our solution is simple, clear, and designed around how you actually sell.

Explore Custom Features

Real Business Applications

  • E-commerce: sales, orders, conversion rate, top products, inventory, returns, delivery performance
  • Retail: store sales, product categories, staff performance, foot traffic, stock turnover
  • B2B Sales: pipeline value, deal stages, sales cycle, win rates, forecast accuracy
  • Service Businesses: bookings, capacity usage, upsells, retention, profit per service
  • SaaS & Subscriptions: MRR, growth, churn, customer value, conversion rates
See Real-World Impact

Our Implementation Process

Week 1 – Discovery & Requirements

Understand your sales process, goals, pain points, metrics, systems, and who needs dashboard access.

Week 2 – Data Mapping & Integration

Connect all data sources, ensure consistency, automate refreshes, and implement quality checks.

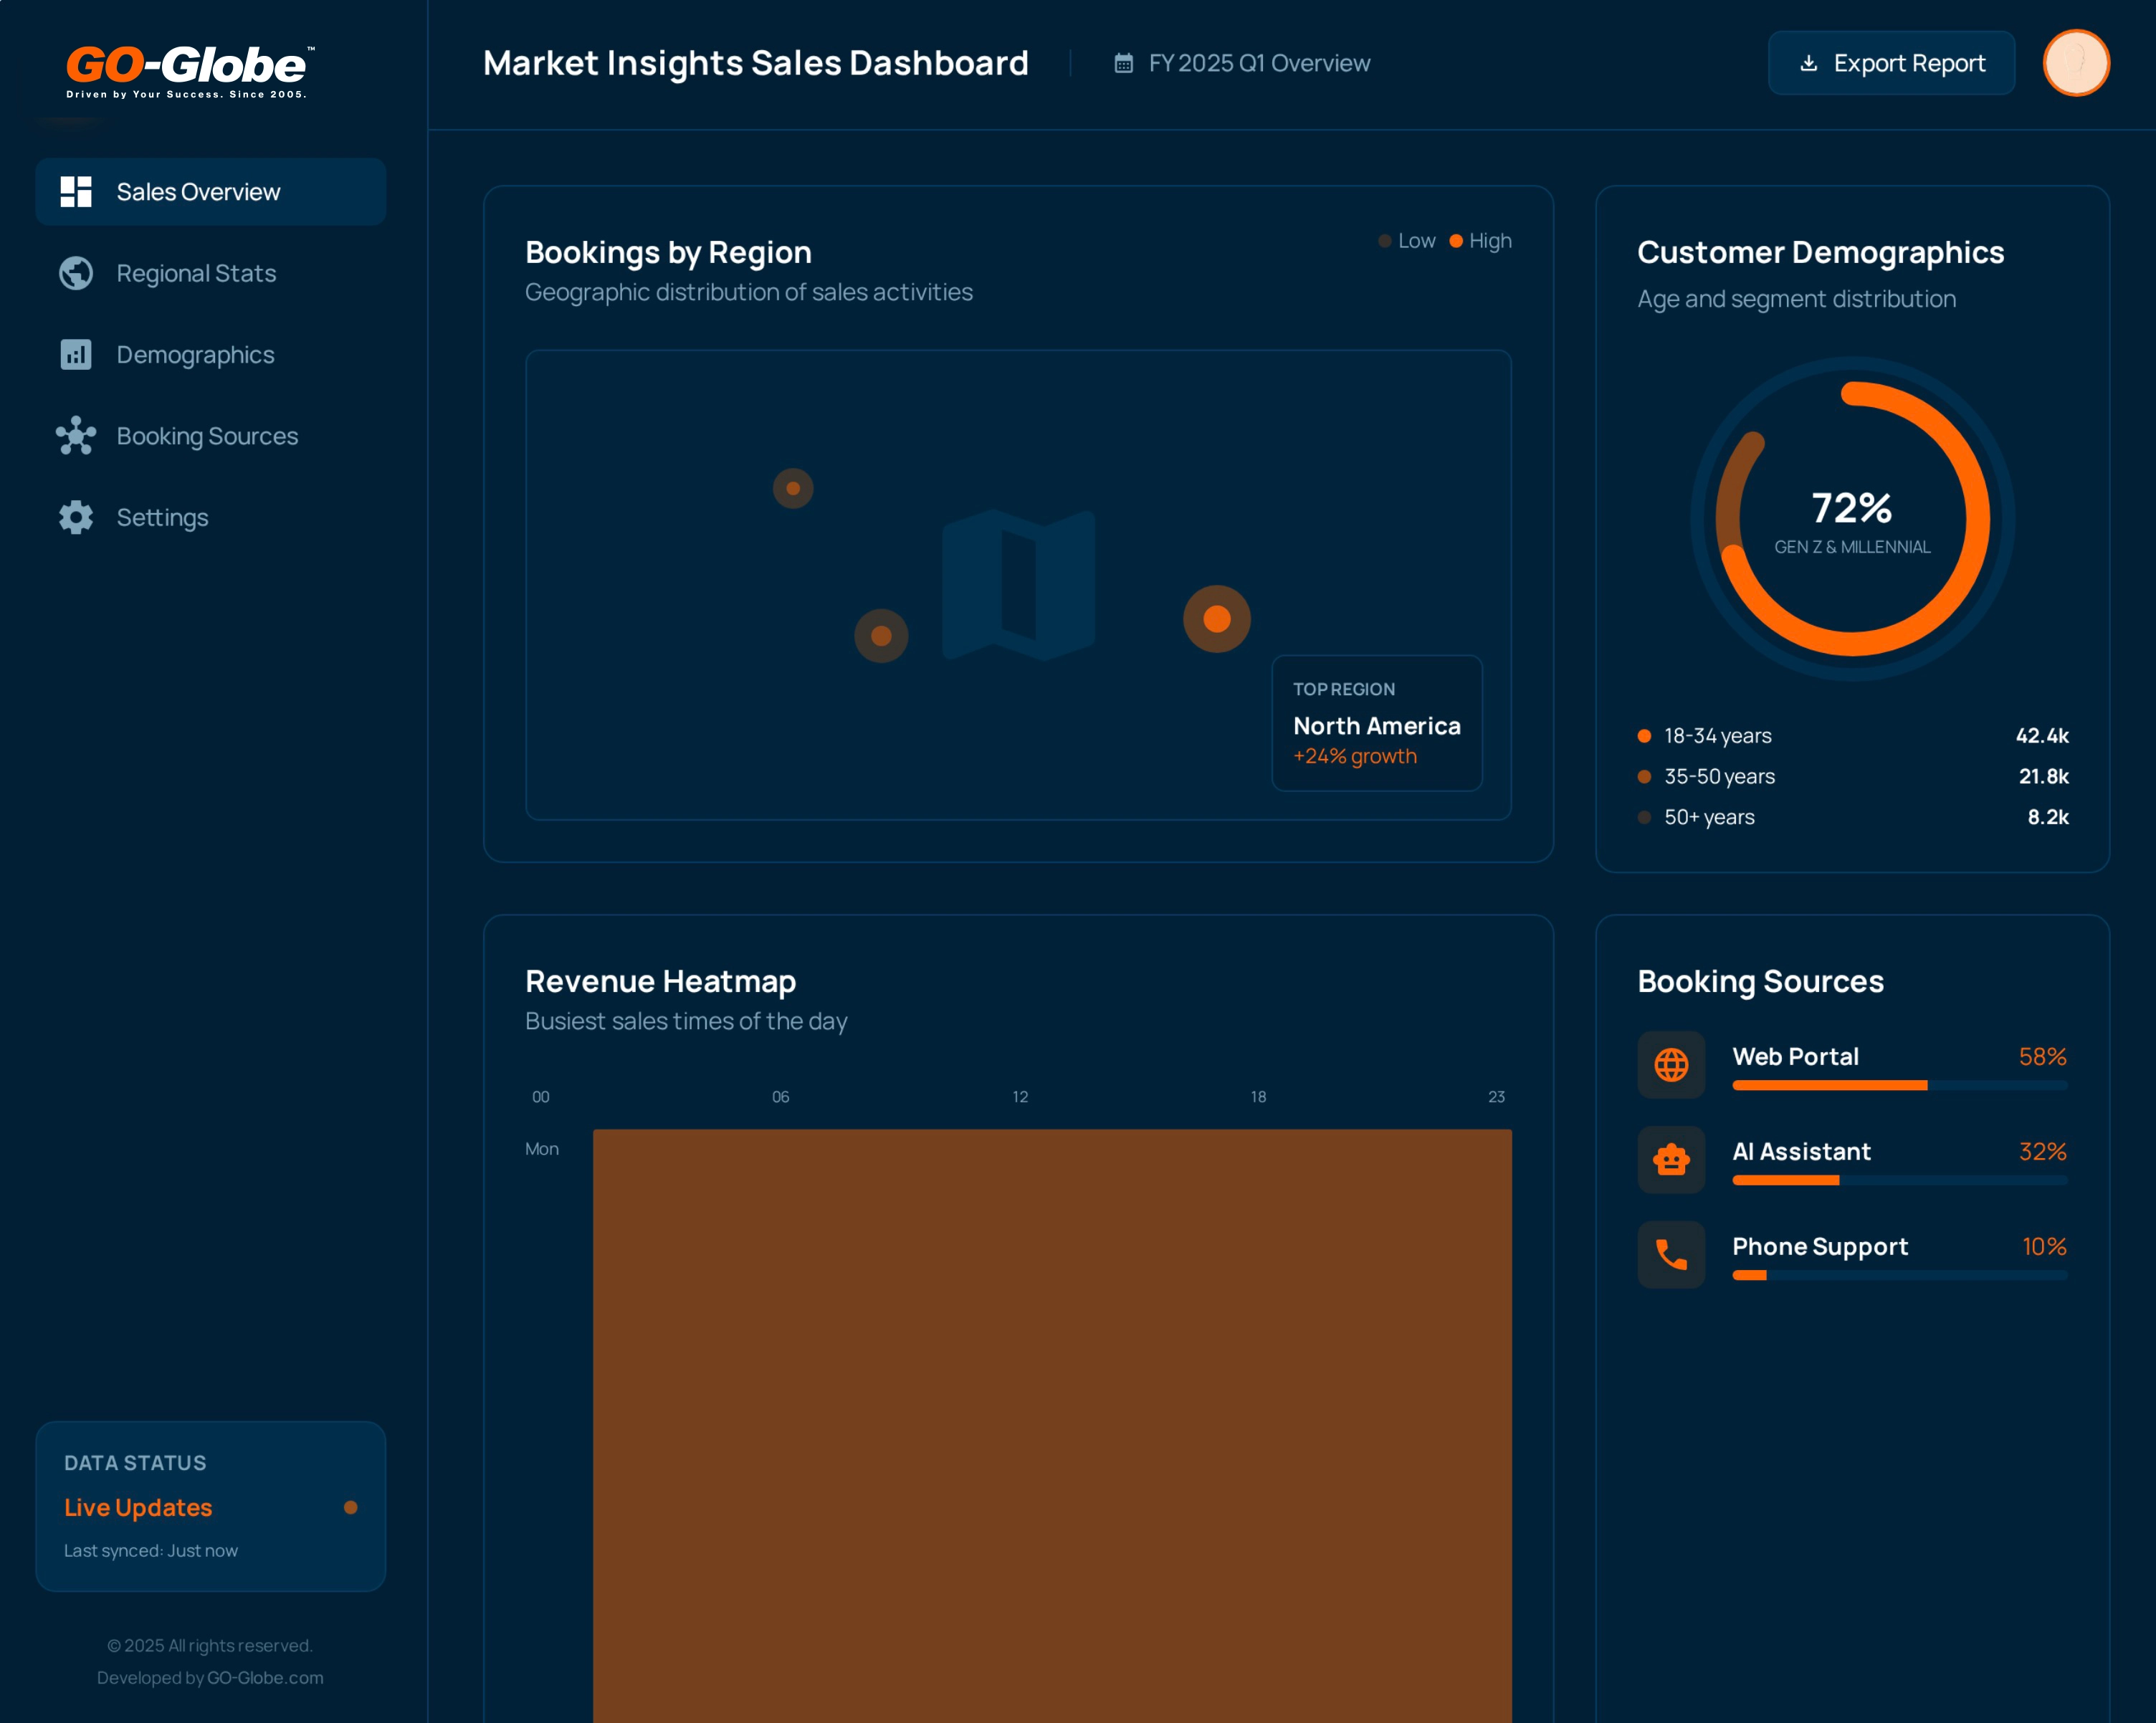
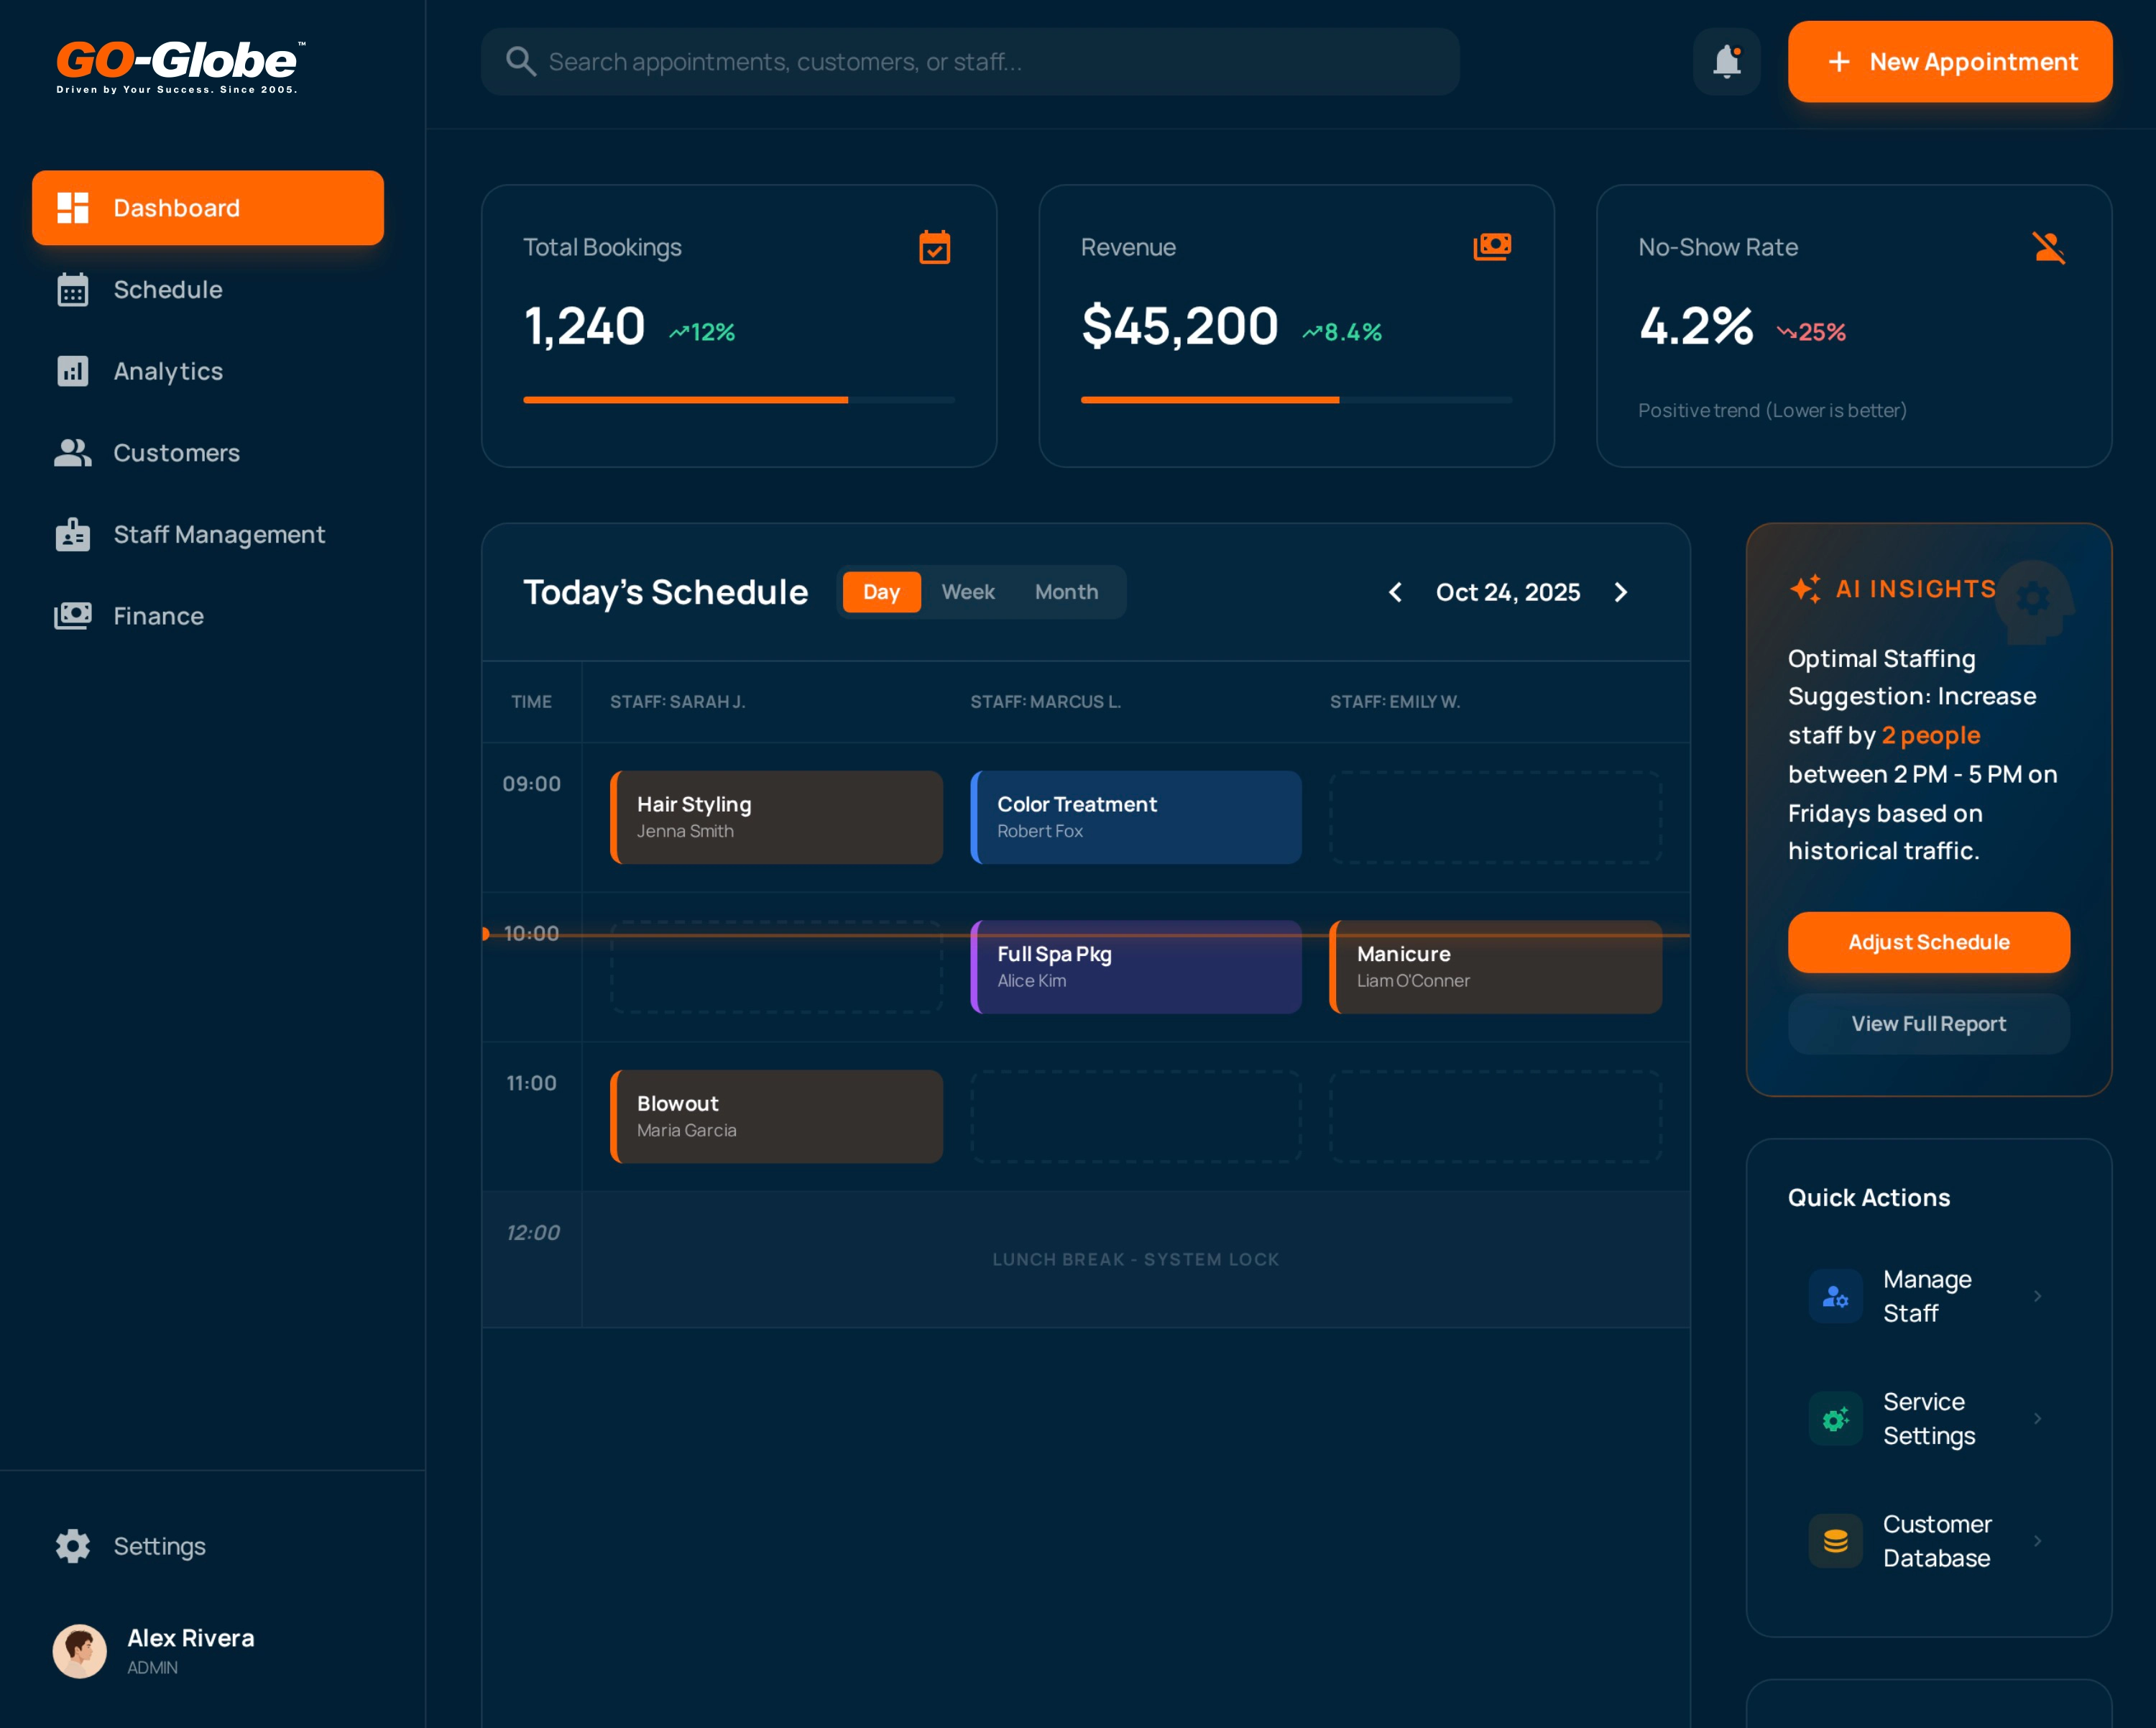
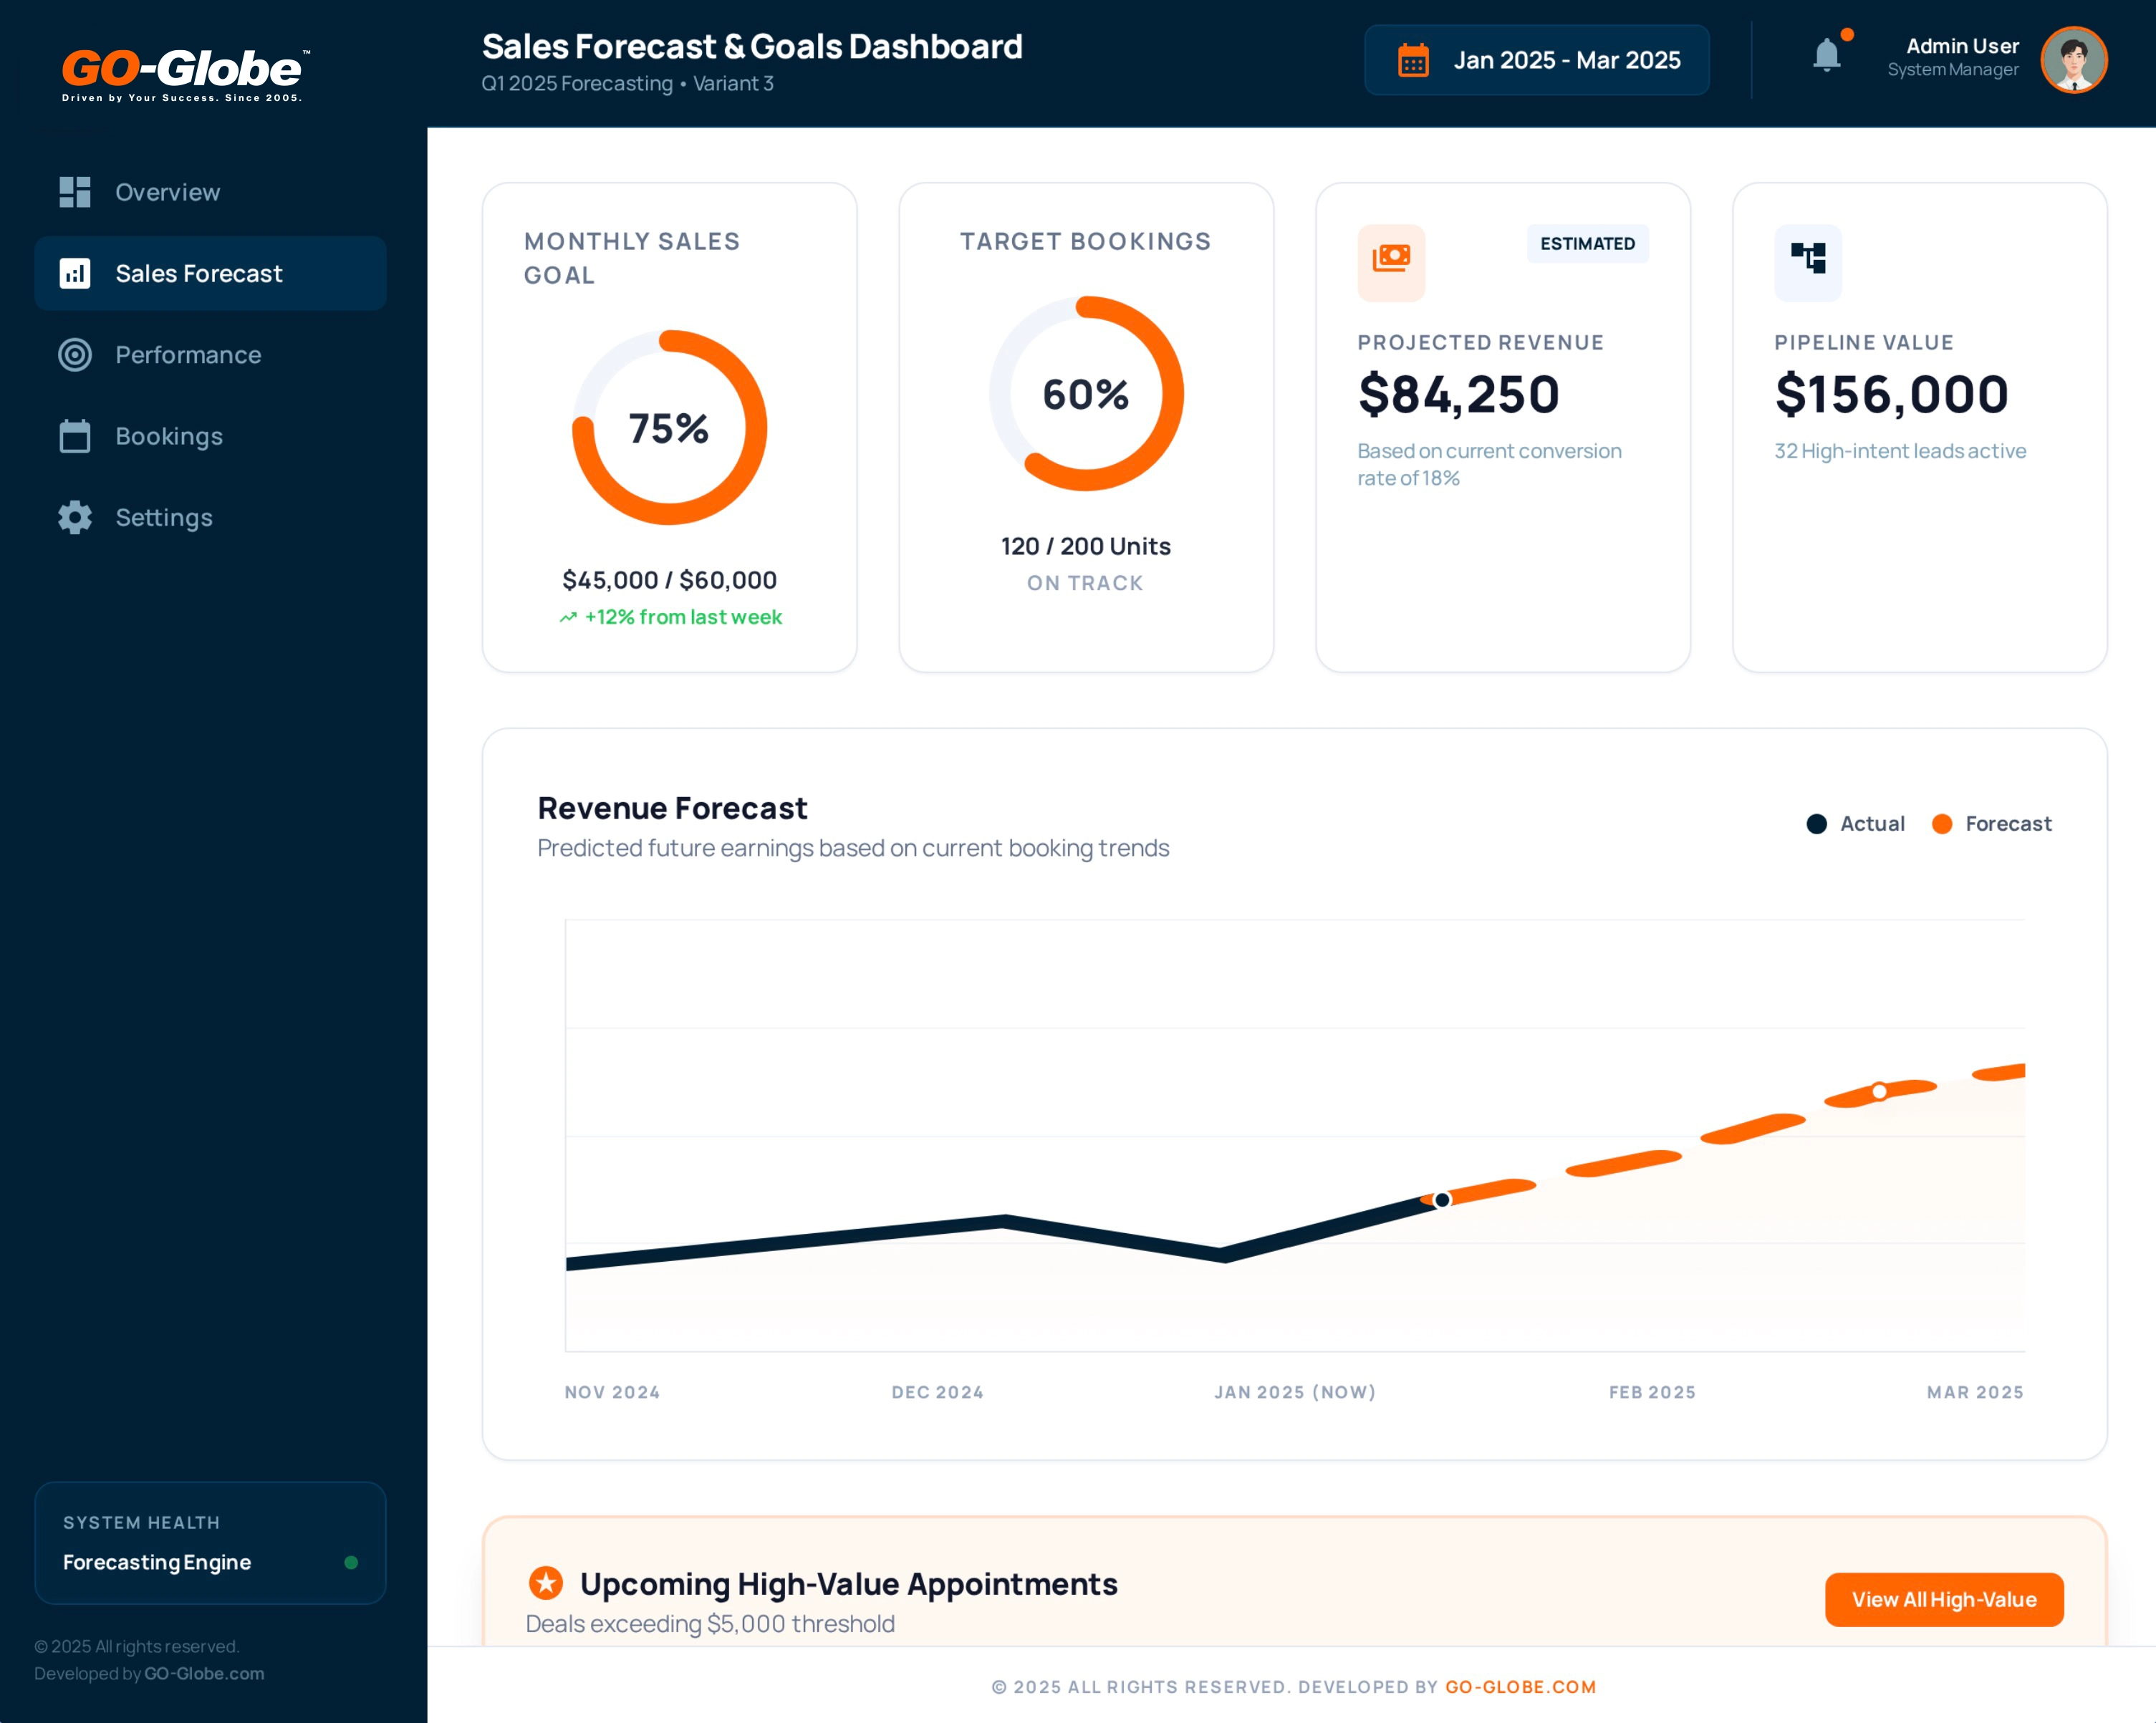
Weeks 3-4 – Dashboard Design & Build

Create layouts, charts, visualizations, role-specific views, drill-downs, and alerts.

Week 5 – Testing & Refinement

Verify data accuracy, device compatibility, formulas, permissions, and performance. Adjust as needed.

Week 6 – Training & Launch

Train your team, provide guides, and launch dashboards for full access.

Get My Dashboard

Results You Can Expect

Implementing sales dashboards delivers immediate, measurable results:

  • 70–90% Less Reporting Time: Replace hours of manual prep with instant, real-time data access.

  • 20% Productivity Boost: Teams stay accountable and focused when targets are clearly visible.

  • Proactive Problem Solving: Spot pipeline issues and falling conversion rates weeks earlier to prevent revenue loss.

  • Data-Driven Confidence: Stop relying on "gut feelings" and start making decisions based on accurate, live forecasts.

Calculate My ROI

Ready to See Your Sales Data Transform into Insights?

Stop making decisions in the dark or wasting hours on manual reports. Sales dashboards provide total visibility, allowing you to identify opportunities and fix problems in real time. By managing with data instead of instinct, your team stays accountable and your business scales with confidence. Join the market leaders who optimize constantly through actionable insights.

Get Started Today

Frequently Asked Questions

Most custom sales dashboards are fully operational within 6 to 8 weeks from project kickoff. Simple dashboards with fewer data sources can launch faster. Complex enterprise dashboards with many integrations may take longer.

Almost certainly yes. We integrate with virtually all major CRM, e-commerce, ERP, and business systems. If your system has an API or can export data, we can connect it. For custom or proprietary systems, we work with your technical team to establish connections.

Dashboards aren't static. We build them to be flexible and updatable. When your process changes, we adjust your dashboard to reflect the new reality. This can include adding new metrics, reorganizing layouts, or integrating additional data sources.

Security is fundamental to our approach. We implement role-based access controls, encrypt data in transit and at rest, comply with relevant data protection regulations, regularly audit access and usage, and follow industry security best practices. Your sensitive sales data remains protected.

Absolutely. Many clients begin with a core set of metrics and expand their dashboards over time as they identify additional needs. This phased approach lets you get value quickly while building toward a more comprehensive solution.

Experience the difference with GO-Globe's world-class services.

Price is what you pay. Value is what you get.
Let’s invest together

Get a Quick Call Back


    © 2005 - 2026 GO-Globe™ Driven by Your Success. Since 2005. All rights reserved.
    This site is protected by reCAPTCHA and the Google. Privacy Policy