


































New York enterprises generate massive data volumes from operations, customers, and markets that remain underutilized without proper analysis tools. AI-powered analytics NYC solutions transform raw data into strategic insights that drive better decisions, optimize operations, and identify growth opportunities. Go-Globe delivers platforms combining advanced analytics with artificial intelligence capabilities that automate reporting, predict outcomes, and surface actionable recommendations.
Modern businesses struggle with disconnected data sources, delayed reporting cycles, and limited analytical expertise across teams. The ai data analytics NYC platform addresses these challenges through unified data integration, real-time processing, and natural language interfaces accessible to non-technical users. Organizations leveraging AI-enhanced analytics experience faster decision-making, improved operational efficiency, and competitive advantages from data-driven strategies.


Old BI tools needed technical skill just to build a basic query. That left most insight locked behind a small team of analysts, with everyone else waiting in line for an answer.
AI changes that math. Conversational interfaces let people ask a plain question and get an answer, no SQL required. The shift is already well underway. More than 60 percent of organizations now embed analytics directly inside the business apps people already use, according to Gartner's 2025 BI Magic Quadrant research.
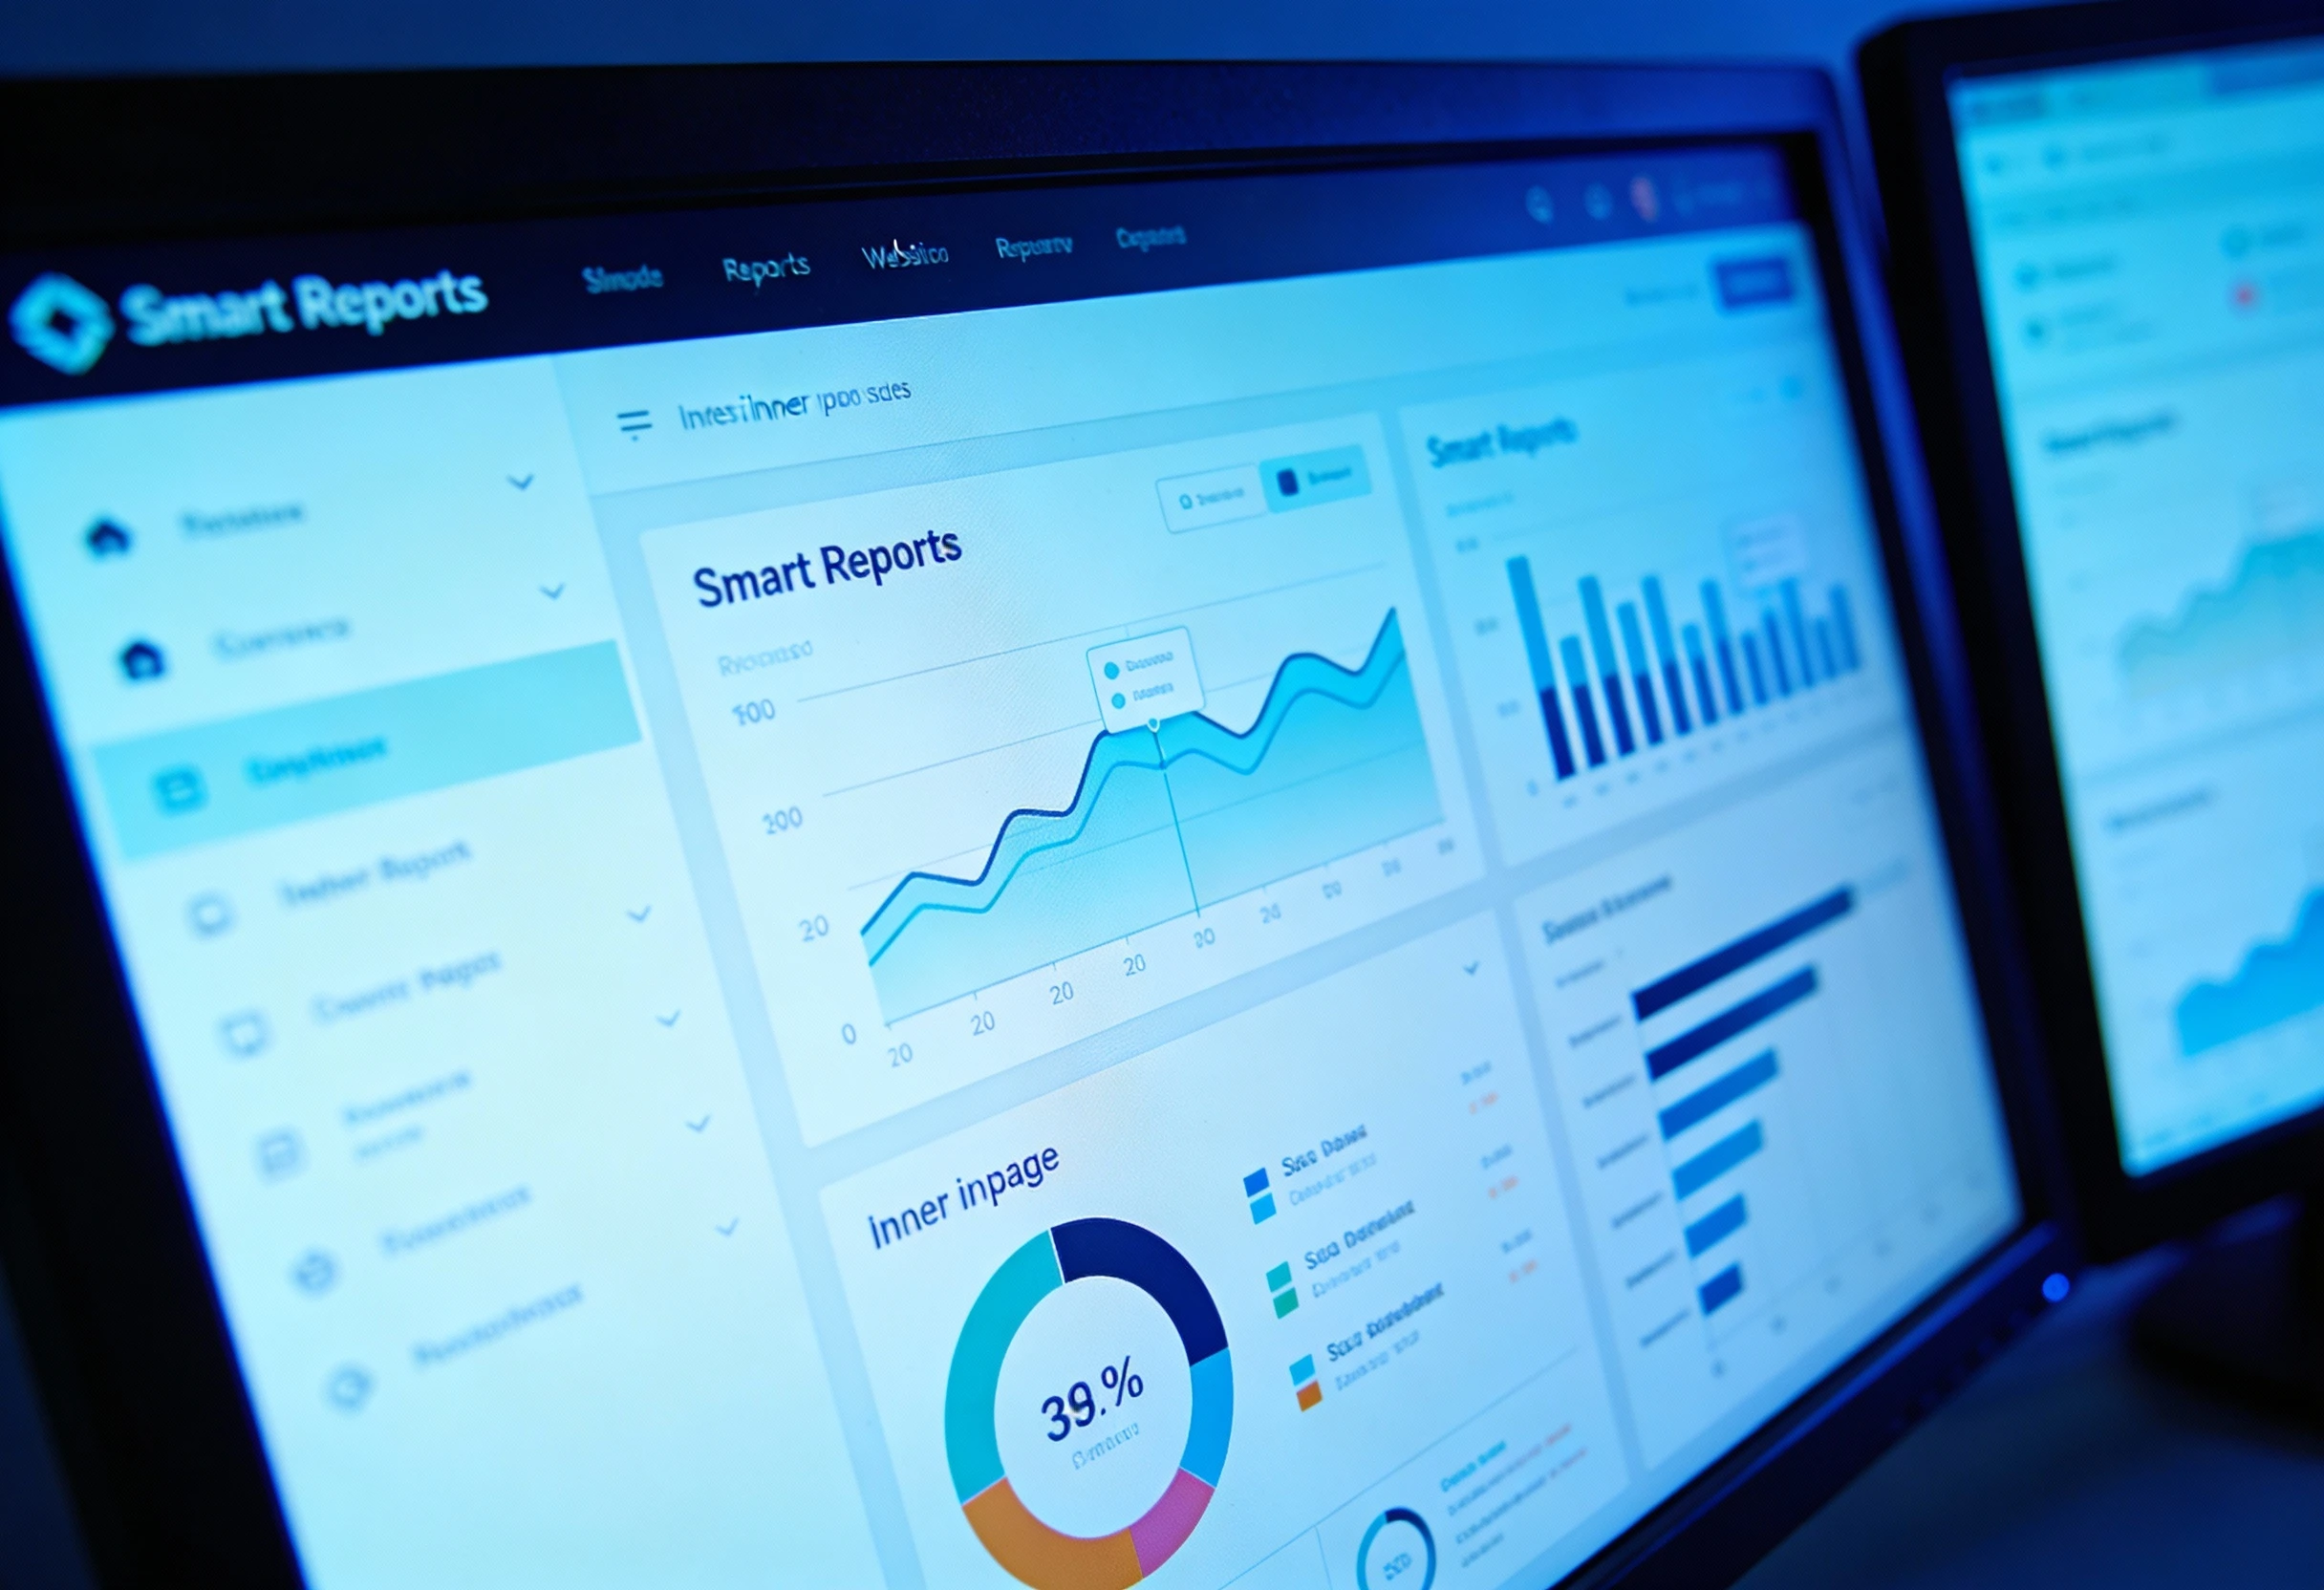
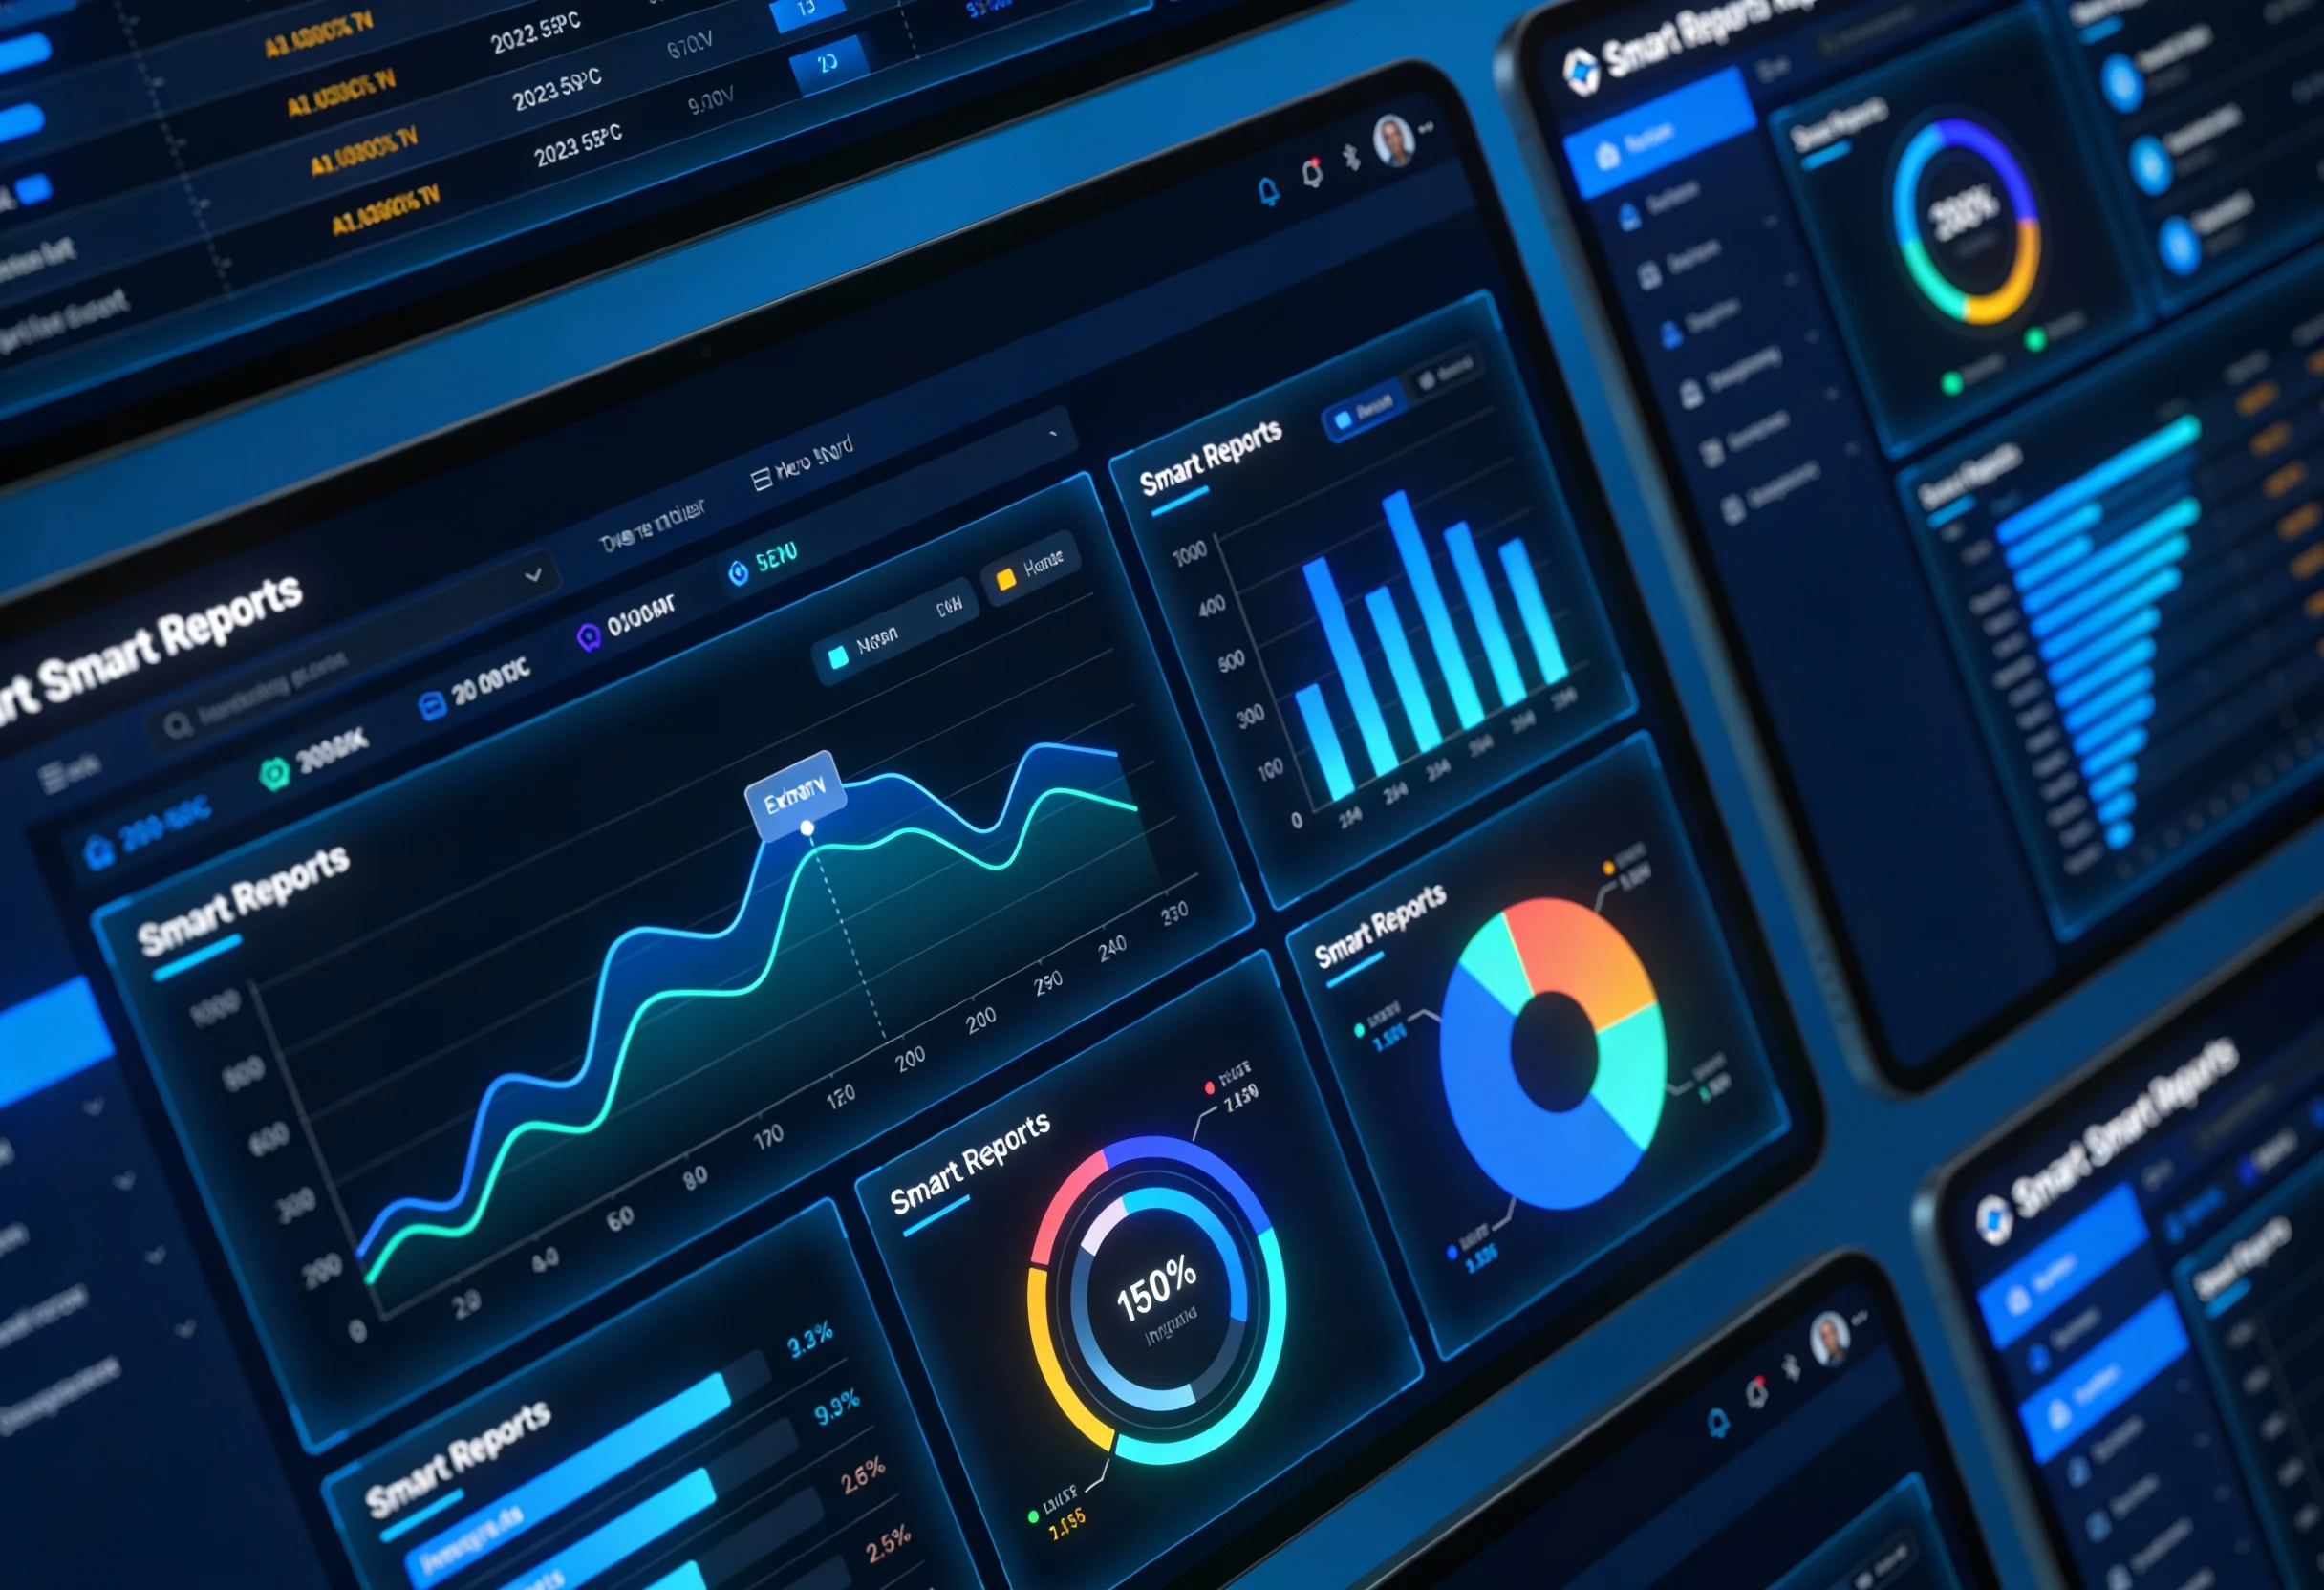
The intelligent dashboards New York platform continuously monitors metrics identifying anomalies, trends, and opportunities automatically. Instead of waiting for monthly reports that describe past performance, leaders receive real-time alerts about emerging issues and proactive recommendations. This shift from reactive reporting to predictive intelligence transforms how organizations leverage data assets.
A good system reviews your data continuously. It flags what actually changed, instead of waiting for someone to notice a number looks off during a monthly review.
When revenue drops in one region, the system traces it back to an actual cause: a slow product line, a pricing change, a supply delay. That cuts hours of manual digging down to minutes.
Nobody on your team should need to learn a query language just to check last week's sales numbers. A natural language interface lets anyone type a question and get a real answer, with the right chart attached.
That independence matters. Your data team stops fielding the same basic request five times a day. Everyone else stops waiting in a queue for an answer that should take ten seconds.
Machine learning models study your history and current trends to forecast sales, inventory needs, or customer churn. That beats a gut-feel estimate almost every time.
These models also retrain themselves as conditions shift. Nobody needs a data science background to keep forecasts accurate. The system watches its own accuracy and adjusts.


Modern intelligent dashboards New York deliver personalized experiences showing metrics relevant to each user's role and responsibilities. Executives see enterprise-wide KPIs, department heads monitor their areas, and individual contributors track personal performance. Role-based customization eliminates information overload while ensuring visibility into relevant metrics.
Interactive visualizations enable exploration from summary views to transaction-level details. Users click chart elements drilling down into underlying data without switching screens or running separate reports. This seamless navigation supports ad-hoc analysis and accelerates investigation.
The ai reporting platform NYC automates report generation, distribution, and scheduling eliminating manual effort. Natural language generation creates narrative explanations of metrics, variance analysis, and performance drivers. Stakeholders understand results without requiring analytical interpretation.
Parameterized reports adapt content based on recipient, time period, or business entity. A single report template serves multiple audiences with appropriate data filtering and formatting. This approach reduces development effort while ensuring consistency.
Version control tracks report changes maintaining audit trails for regulatory compliance and governance. The system documents who modified reports, when changes occurred, and what was altered. Historical versions remain accessible supporting compliance reviews.


Useful analytics depends on pulling data from wherever it actually lives. Databases, cloud apps, APIs, spreadsheets, all of it. We connect to your existing systems through standard connectors and build custom integrations for anything proprietary.
Cleaning that data matters just as much as connecting it. Automated preparation catches quality issues and inconsistencies before they quietly corrupt a report nobody double-checked.
Visibility into product performance, customer preferences, and stock levels. Demand forecasts account for seasonality and promotions, not just last year's flat average.
Risk analysis across credit, market, and operational exposure. Models flag concentration risk before it becomes a real problem on the balance sheet.
Patient data analysis that helps identify higher-risk cases earlier, supporting care teams with information, not making clinical decisions for them.
Equipment monitoring that catches early signs of a failure before it causes unplanned downtime, instead of finding out when a machine actually stops.


Modern predictive analytics ai New York platforms process streaming data from IoT sensors, transaction systems, and customer touchpoints. Real-time analytics detect events requiring immediate action including fraud, equipment failures, and stock-outs. Organizations respond to opportunities and threats as they occur rather than discovering them in retrospective reports.
Complex event processing correlates multiple data streams identifying patterns indicating significant business events. The system triggers automated responses or alerts appropriate personnel. This immediate reactivity provides competitive advantages in fast-moving markets.
If you run a customer portal or product, embedding analytics directly inside it gives your users insight without sending them elsewhere. That is a real feature, not just an internal reporting nicety.
White-label options let service providers offer this under their own brand entirely. The interface matches their look and feel while the underlying engine does the real work.


Analytics touches sensitive business and customer data, so access has to be controlled properly. Role-based permissions mean people see only the data their role actually requires.
Data masking protects personal information while still allowing useful analysis on top of it. The right technique gets applied based on how sensitive that specific data actually is.
Modern smart business intelligence New York platforms leverage cloud infrastructure providing scalability, performance, and cost efficiency. Organizations avoid capital investments in servers while accessing enterprise capabilities. Cloud deployment accelerates implementation and simplifies maintenance.
Multi-region deployment ensures low latency for global users and business continuity. Data replication across geographies protects against outages maintaining service availability. Our cloud services team manages infrastructure operations.


GO Globe combines real analytical expertise with technical skill across AI, data engineering, and visualization design. We focus on what the data actually needs to accomplish, not just on shipping a feature checklist.
Being local in New York means real collaboration and an understanding of this market specifically. We also pair analytics work with digital marketing support. Insights connect directly to how you reach customers, not just to an internal report nobody outside the team ever sees.
AI automates insight discovery, predicts future outcomes, and lets people ask questions in plain language instead of writing a query. You get proactive recommendations, not just a static report describing what already happened.
The platform connects to databases, cloud applications, APIs, files, and streaming sources through pre-built connectors. Custom integrations cover proprietary systems so nothing important gets left out.
No. Natural language interfaces let non-technical users ask questions and get real insights without knowing SQL or any coding. That is the whole point of democratizing analytics across a team.
Most projects run 4 to 12 weeks depending on data complexity and how many integrations you need. A phased approach can deliver real value in 2 to 4 weeks, with more features layered in after.
Yes. Streaming data processing supports real-time monitoring, alerting, and automated responses. You catch and react to events as they happen instead of finding them in a report days later.